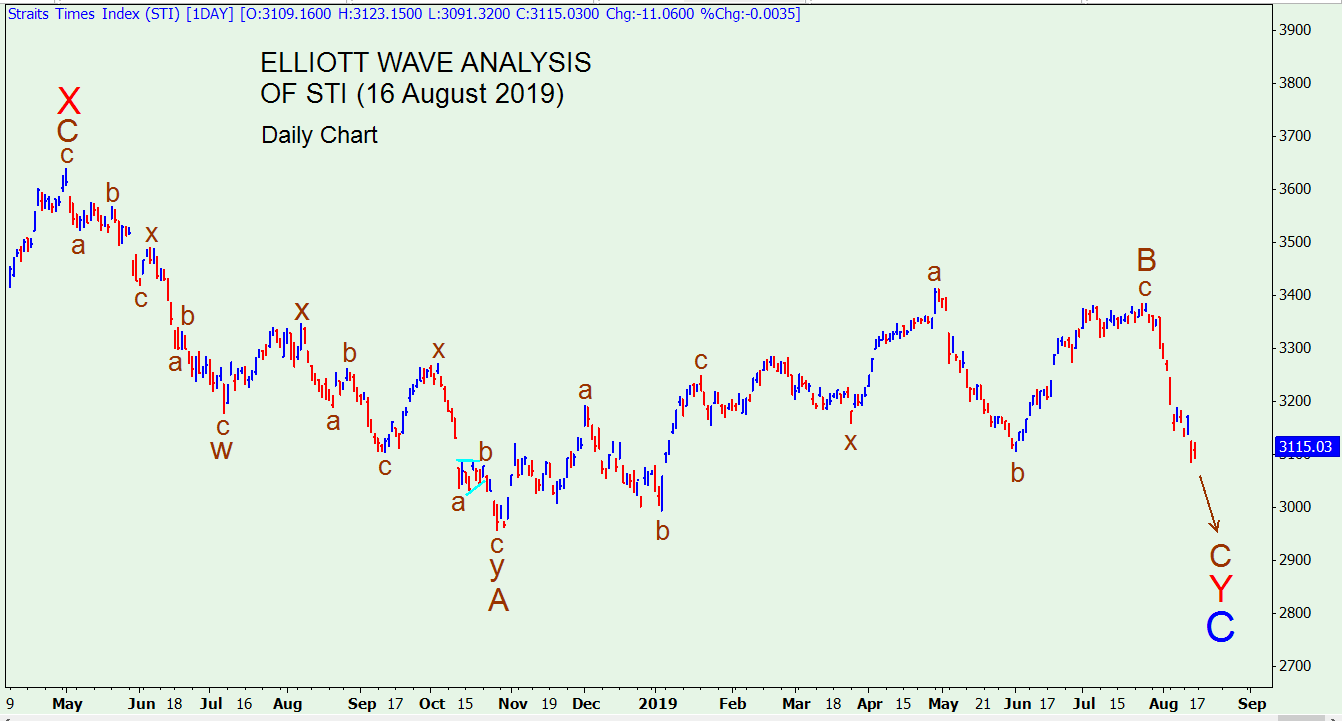
New Wave Count
The previous wave count has been invalidated. The new count is shown above. I had to examine the longer term monthly and weekly STI charts to derive the daily wave count.
First let us look at the monthly chart below.
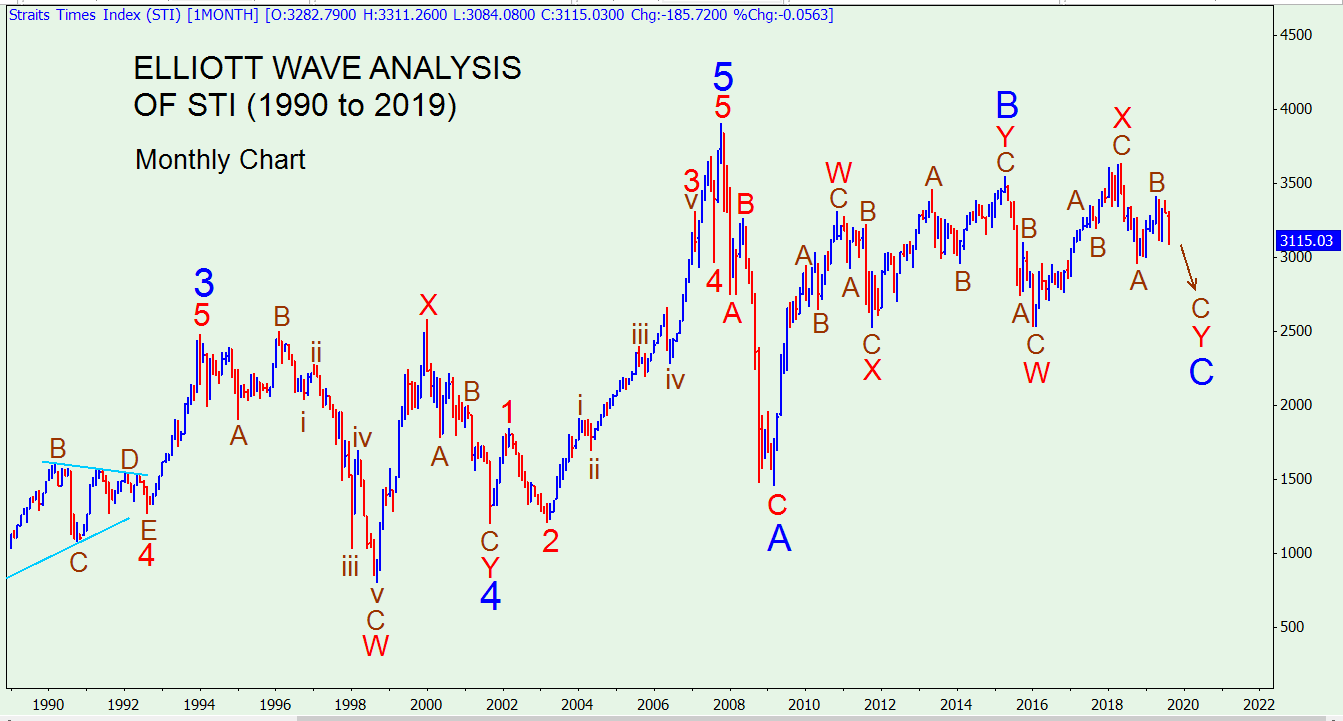
You can see that after the financial crisis in 2008/2009, the STI recovered but has gone sideways since. The recent waves are part of this very long sideways correction. It looks like Major Wave C (blue) is forming, which could go down very deeply. Now let us look at the weekly chart.
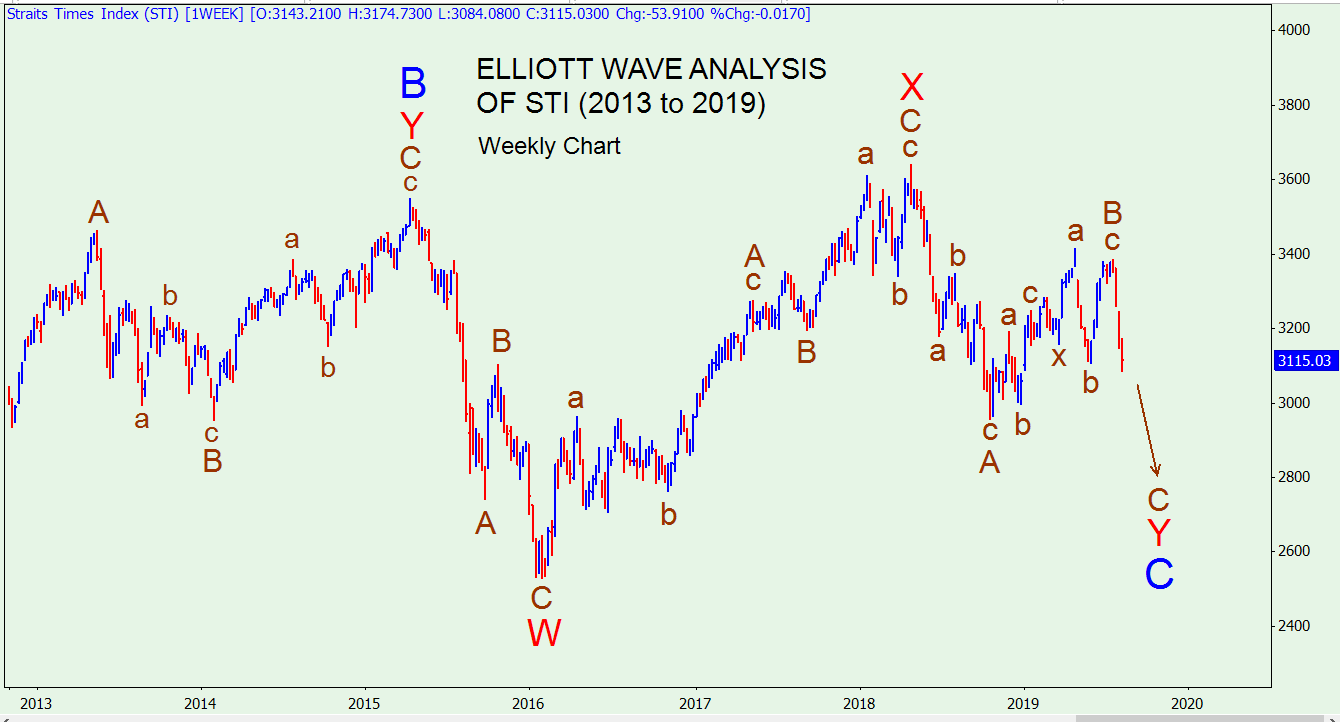
You can correlate the monthly and weekly charts by looking at Major Wave B (blue) and the current Major Wave C (blue). The detailed wave counts are shown. Now you can correlate the weekly chart with the daily chart at the top, which starts from the top of Wave X (red). Subwaves A (brown) and B (brown) look flat compared to the weekly chart, as the daily chart expands them out.
The conclusion is that the STI is reacting to the fears of recession in Singapore caused by the US-China trade war and economic downturns in many countries, and the outlook is rather bleak.