Bottom?
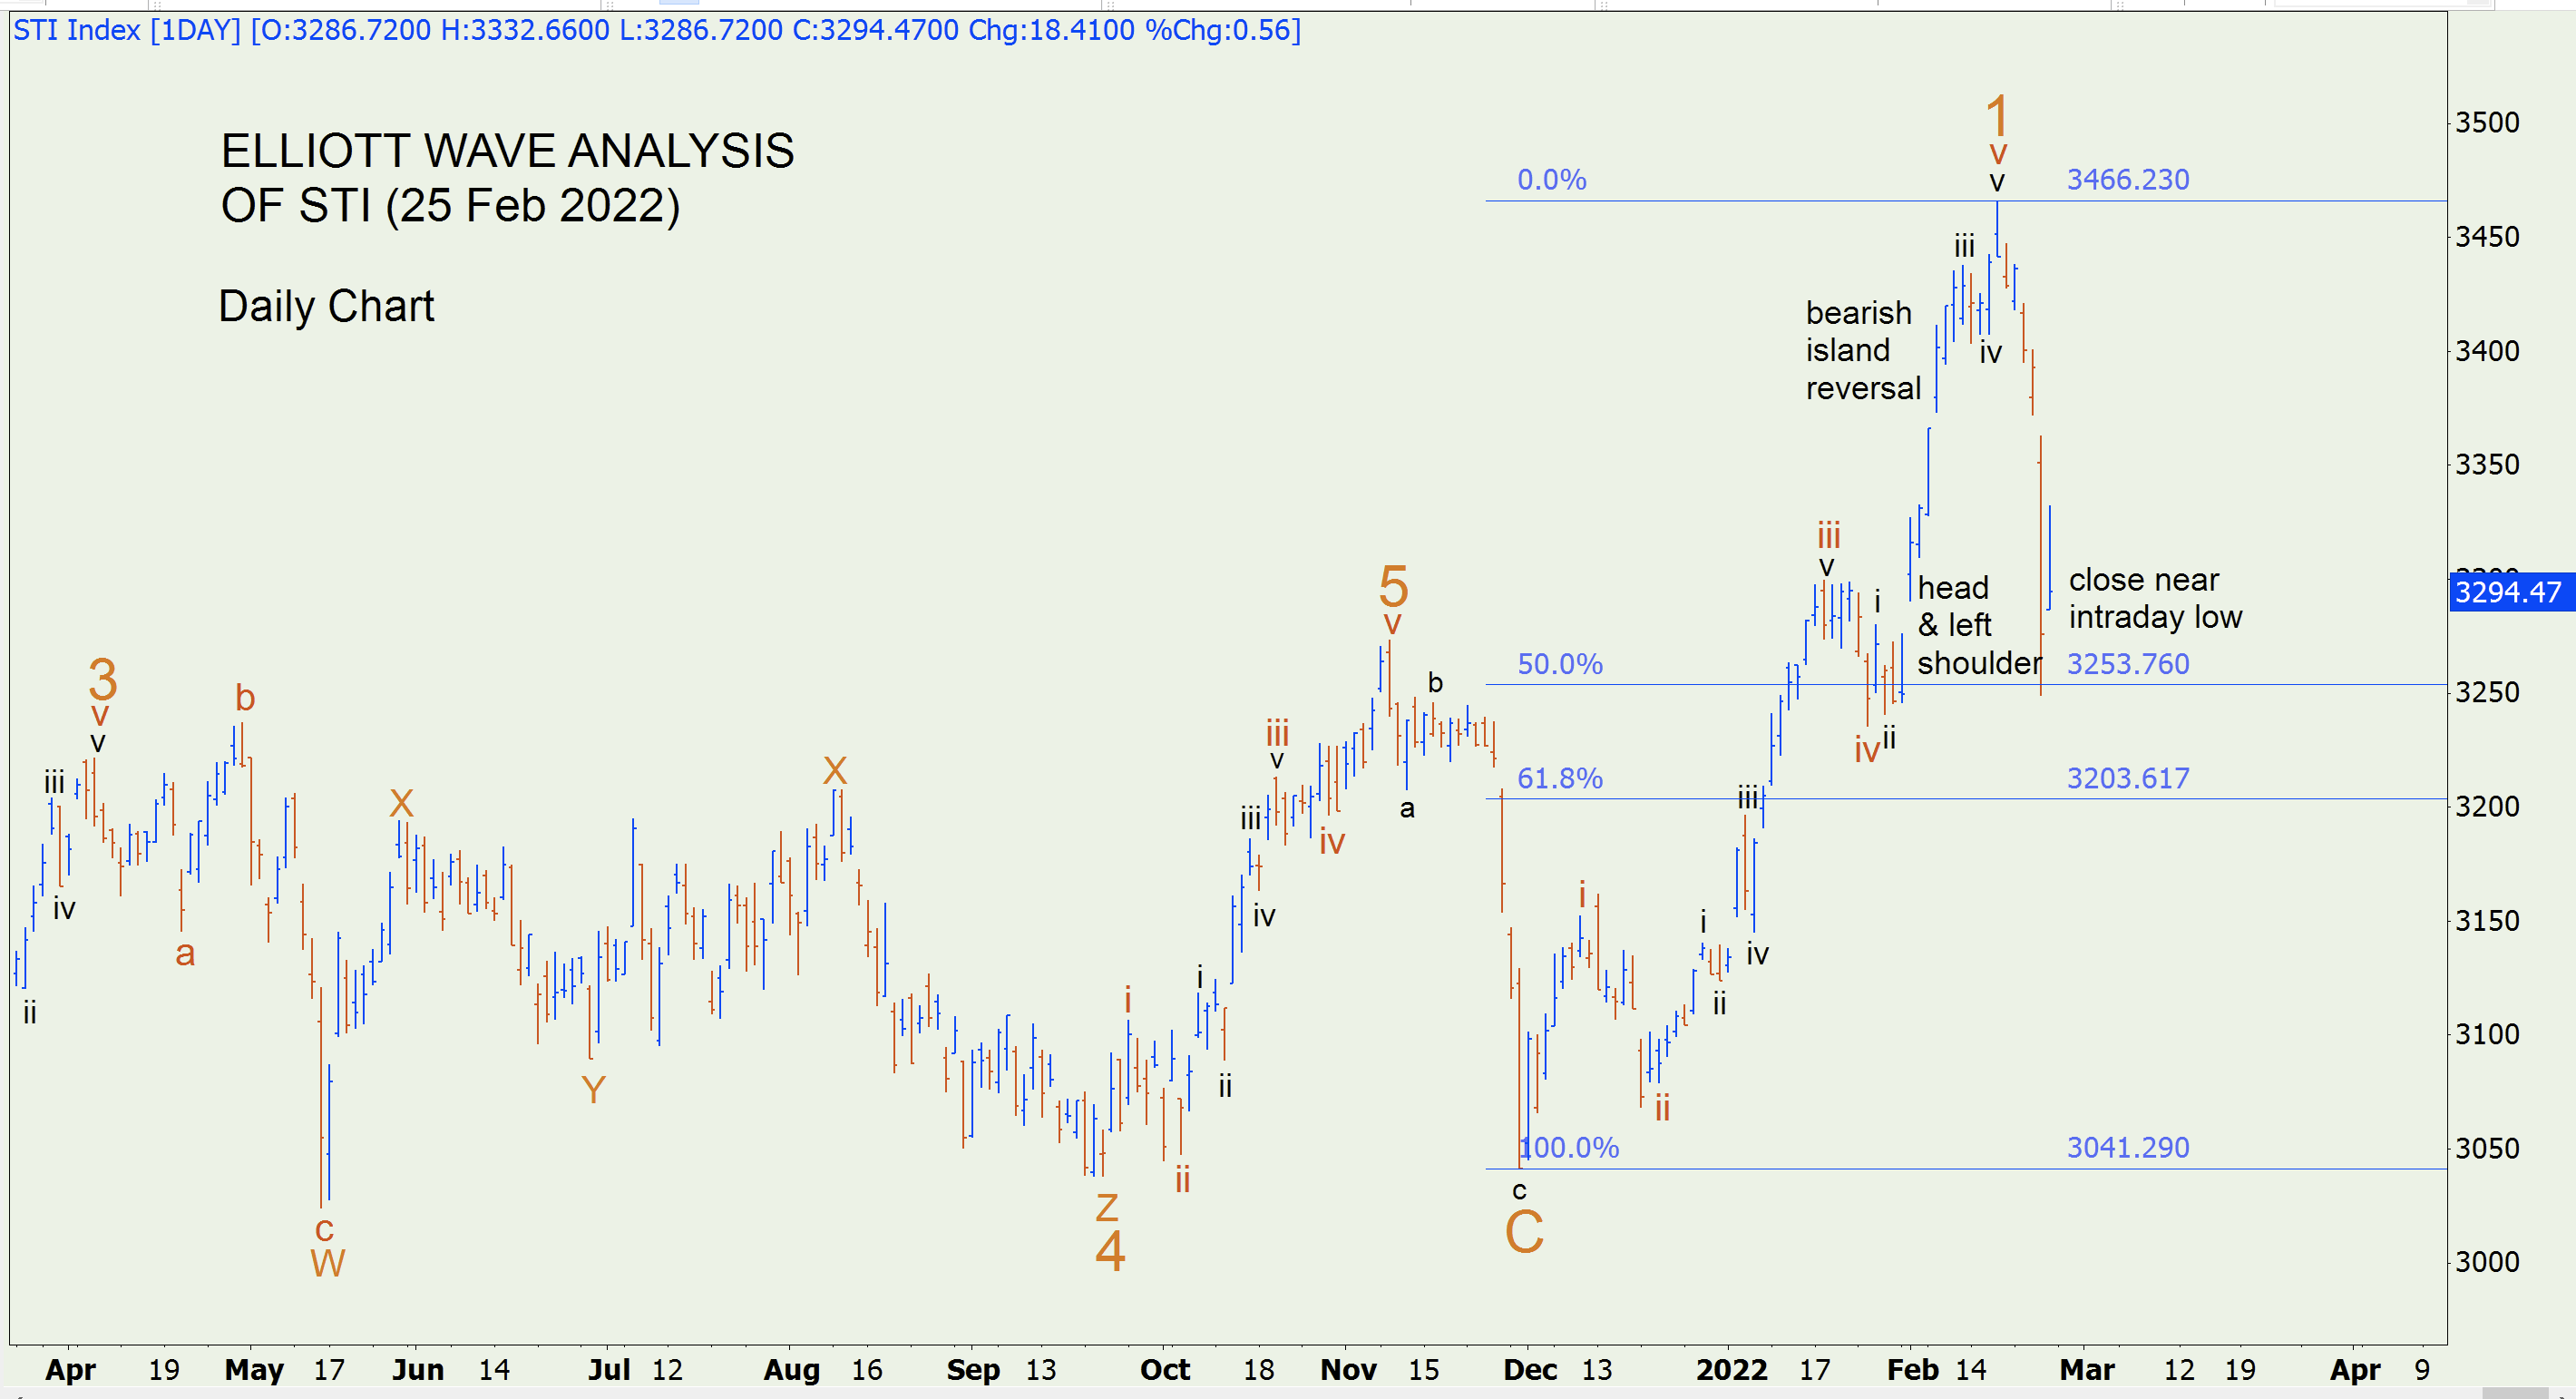
Yesterday the STI crashed but recovered somewhat today. But we are not yet out of the woods. The STI could drop again next week, perhaps going below yesterday’s low. There are three ominous signs as shown in the chart. There is a bearish island reversal at the top of Wave 1 (red) / Subwave v (red). (This looks like an inverted V.) The total drop in the index of 217 points from the top may or may not satisfy this bearish structure.
Secondly, today the index closed at 3294.47 which is near the intraday low of 3286.72. Buyers largely left the scene by midday and there could be more sellers than buyers next week. Finally, since 11 Jan 2022 the STI has formed a left shoulder and a head, in what could turn out to be a head and shoulders formation, another bearish formation. This would be the case only if a right shoulder is formed, which may or may not happen.
On a positive note, it may be the case that yesterday the STI reached a bottom. In my 11 Feb blog I said that besides a 81.6% retracement, a common retracement for Wave 1 is 50%. Indeed yesterday’s bottom was at about a 50% retracement and was near the end of Subwave iv (red). It is common for a first wave to retrace back to the bottom of a fourth wave of one lower order. These are positive signals that counter the bearish signals described above.
Given the great uncertainty I would not rush into the market. I would wait until the STI crosses well above the resistance level indicated by the two feet of the island reversal, at about 3370. And even then, I would tread cautiously.